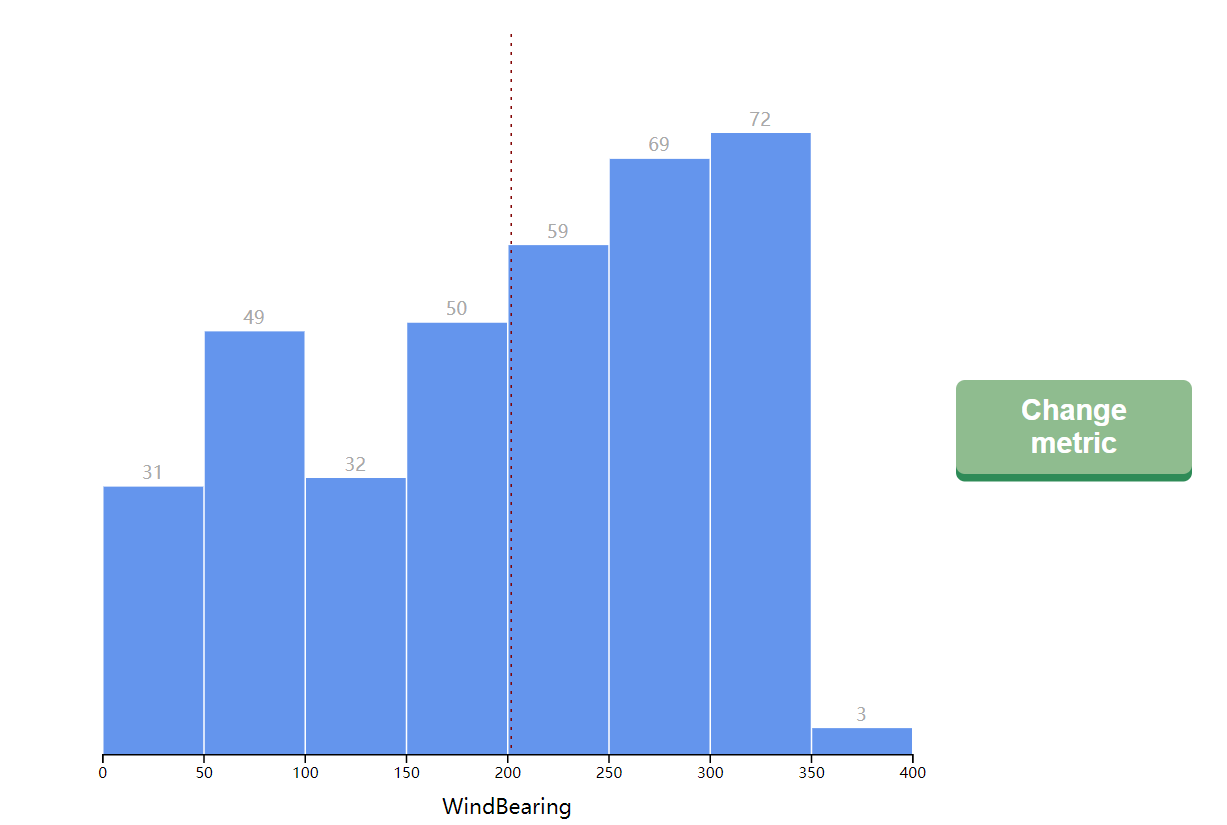
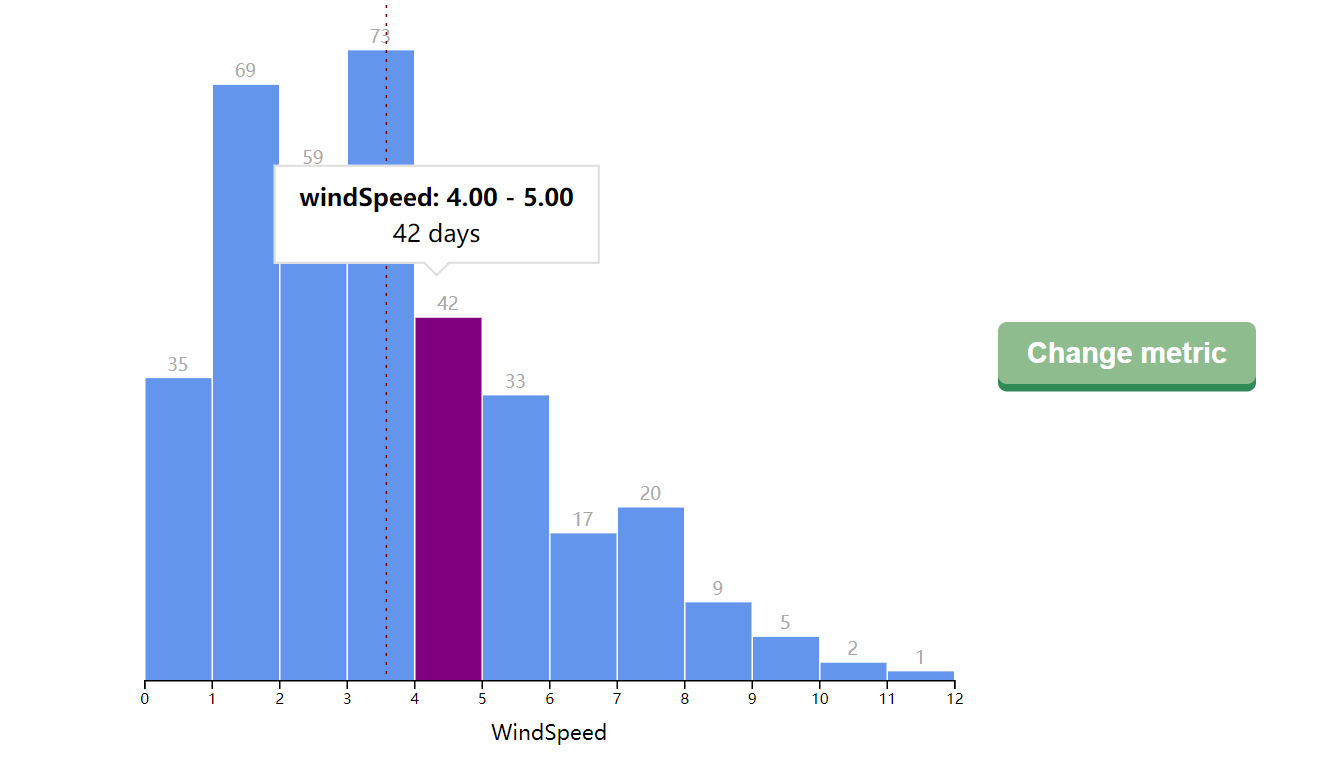
这回我们用祖传的数据来画一个雷达图
绘制边框
参数和数据载入的过程和之前别无二致,准备工作完成之后,我们先来绘制几个同心圆,来作为雷达图的基础边框
1
2
3
4
5
6
7
8
9
| const axis = bounds.append("g")
const gridCircles = d3.range(4).map((d, i) => (
axis.append("circle")
.attr("cx", dimensions.boundedRadius)
.attr("cy", dimensions.boundedRadius)
.attr("r", dimensions.boundedRadius * (i / 3))
.attr("class", "grid-line")
))
|

我们准备在雷达图上显示六种属性,因此接下来我们要画对应的六个坐标轴,和同心圆一样,我们也可以用map来实现
1
2
3
4
5
6
7
8
9
| const gridLines = metrics.map((metric, i) => {
const angle = i * ((Math.PI * 2) / metrics.length) - Math.PI * 0.5
return axis.append("line")
.attr("x1", dimensions.boundedWidth / 2)
.attr("x2", Math.cos(angle) * dimensions.boundedRadius + dimensions.boundedWidth / 2)
.attr("y1", dimensions.boundedHeight / 2)
.attr("y2", Math.sin(angle) * dimensions.boundedRadius + dimensions.boundedWidth / 2)
.attr("class", "grid-line")
})
|
数据绘制
首先我们将要展示的属性标注在画出来的同心圆的边界上
1
2
3
4
5
6
7
8
9
10
11
12
13
14
15
16
| const labels = metrics.map((metric, i) => {
const angle = i * ((Math.PI * 2) / metrics.length) - Math.PI * 0.5
const x =
Math.cos(angle) * (dimensions.boundedRadius * 1.1) + dimensions.boundedWidth / 2
const y =
Math.sin(angle) * (dimensions.boundedRadius * 1.1) + dimensions.boundedHeight / 2
return axis.append("text")
.attr("x", x)
.attr("y", y)
.attr("class", "metric-label")
.style("text-anchor",
i == 0 || i == metrics.length / 2 ? "middle" :
i < metrics.length / 2 ? "start" : "end"
)
.text(metric)
})
|
text-anchor是对给定点的对齐方式,因为我们是标注在圆周外边的,所以肯定有文本的开头在给定点,文本的结束位置在给定点和文本的中点在给定点三种,因此我们需要根据其下标决定对齐方式
然后将数值在图表上表示出来,这里我们希望画一个闭合的图形,所以采用d3.lineRadial(),需要设置角度和半径,.curve(d3.curveLinearClosed)则将最后一笔连上,形成闭合图形
1
2
3
4
5
6
7
8
9
10
11
12
13
| const line = bounds.append("path")
.attr("class", "line")
const drawLine = (day) => {
const lineGenerator = d3.lineRadial()
.angle((metric, i) => i * ((Math.PI * 2) / metrics.length))
.radius((metric, i) => metricScales[i](+day[metric] || 0))
.curve(d3.curveLinearClosed)
const line = bounds.select(".line")
.datum(metrics)
.attr("d", lineGenerator)
.style("transform", `translate(${dimensions.boundedRadius}px, ${dimensions.boundedRadius}px)`)
}
|
最后我们加入按钮用于切换对应的日期,显示对应的属性
1
2
3
4
5
6
7
8
9
10
11
12
13
14
15
| let activeDayIndex = 0
const title = d3.select("#title")
const dateFormatter = d3.timeFormat("%B %-d, %Y")
const updateChart = () => {
title.text(dateFormatter(dateAccessor(dataset[activeDayIndex])))
drawLine(dataset[activeDayIndex])
}
updateChart()
d3.select("#show-next-day").on("click", e => {
activeDayIndex = (activeDayIndex + 1) % (dataset.length - 1)
updateChart()
})
|
[演示地址]